How brands can use real-world movement intelligence to identify where family demand is forming, intercept competitor audiences, and drive measurable incremental visits, ROAS, and market share.
By Mitali Jadia
Marketing Manager, MEmob+
Published: July 2026
Connect on LinkedIn: mitalijadia
GCC Back-to-School 2026 in 90 Seconds (The Quick Take)
- The Scale: Back-to-School isn’t a brief retail promo; it’s a total shift in lifestyle for 1,712,151 core targetable parents across the UAE, KSA, and Qatar.
- The Infrastructure: This seasonal intelligence is backed by a native regional infrastructure processing 10M+ daily touchpoints and tracking 400M unique devices across MENA.
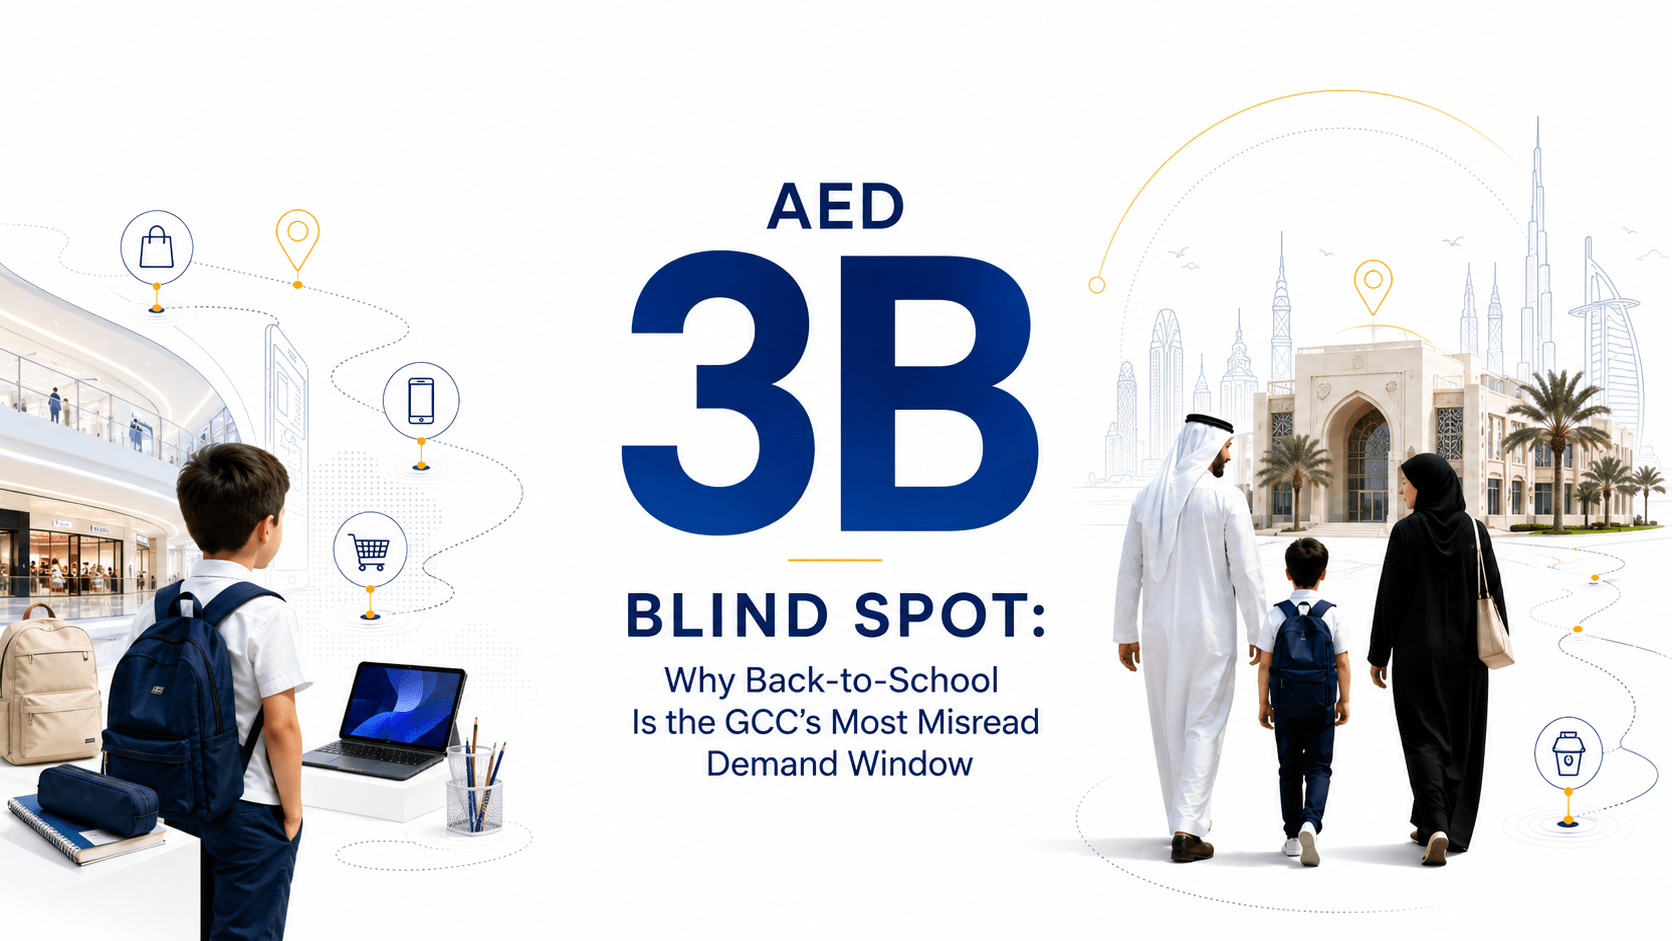
- The Blind Spot: While seasonal retail turnover cracks AED 3 billion in the UAE alone, brands are burning marketing budgets on generic online demographic tags instead of tracking real-world family movement.
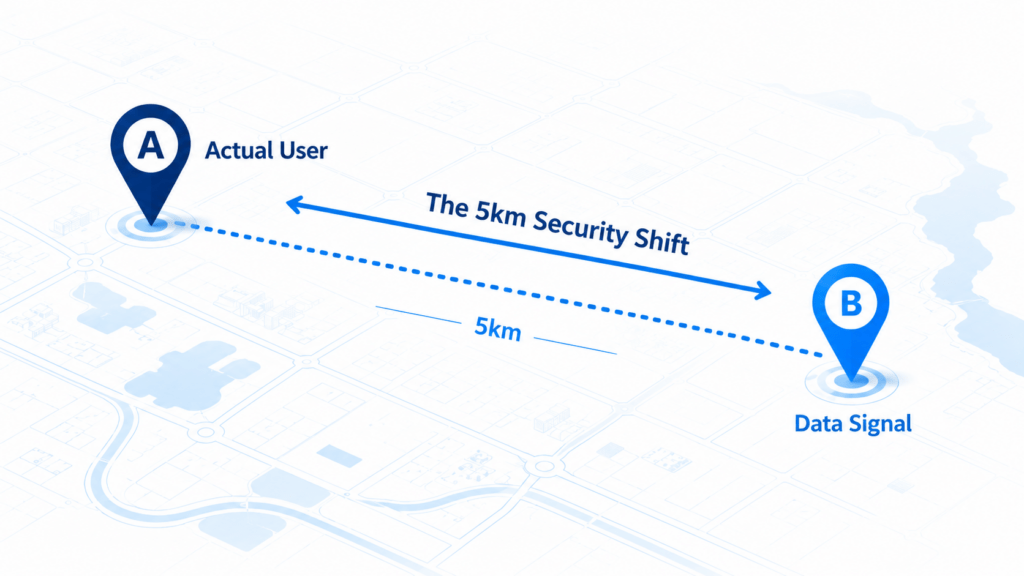
- The Problem: Standard location data is highly inaccurate, carrying up to a 5-kilometer error margin that mistakes highway traffic for store shoppers.
- The Solution: True growth means cleaning raw signals down to a tight 4.77-meter grid (Geohash Level 9) to track true intent, grounding campaigns in local country nuances, and measuring real store visits rather than empty online clicks.
Back-to-School is not a simple retail spike. It is not a static marketing moment. It is definitely not a generic two-week discount campaign.
It is a complete, temporary reorganization of family life. And when a family’s daily routine completely resets, their spending behavior resets right along with it.
Today, Back-to-School has grown into a complex, multi-location, multi-category, high-intent journey. Online shopping has grown 18%. Mobile commerce now accounts for 47% of BTS purchases. But the real opportunity lies in the connection between digital intent and physical movement, the mall visit, the school run, the electronics comparison, the supermarket stop, the QSR meal, the last-minute weekend rush.
If you walk into any major mall across Dubai, Riyadh, or Doha on the last Saturday of August, you know exactly what this looks like. The food courts are packed. The lines outside uniform shops stretch down the corridors. You see parents balancing corporate calls on speakerphones while trying on their kids’ running shoes, while the electronics sections are filled with families intensely debating laptop specs.
To the casual observer, it’s just seasonal retail chaos. But if you’re a CMO, CEO, or enterprise leader, what you’re actually looking at is a massive, highly synchronized human migration condensed into a tight, 10-day window.
Demand Window Brands Shouldn’t Be Treated Like a Media Burst
Back-to-School across the UAE, Saudi Arabia, and Qatar isn’t just a brief blip on the Q3 radar. It’s a monumental commercial wave, pulling in over AED 3 billion (around USD 820 million) in retail sales in the UAE alone. This seasonal surge runs parallel to a massive structural expansion of the regional private K-12 education market, which is scaling toward an incredible USD 65.71 billion by 2031 according to the latest Mordor Intelligence GCC Private K-12 Education Market Analysis.
As we map out strategies for the peak of August 2026, many brands naturally fall back on traditional media playbooks built primarily for a digital-only landscape. This usually means securing broad online demographic buckets, launching programmatic banners at the start of August, and organizing a final-weekend mall activation.
That may still create visibility. But visibility alone is no longer enough.
The brands that win this season won’t be the ones with the loudest media budgets. They’ll be the ones that shift from generic digital reach to real-world, psychology-driven spatial intelligence.
Let’s look at how families actually move, where traditional data misses the signal, and how to plan the season with absolute data precision.
The Accuracy Gap: Mistaking Data Volume for Market Precision
When evaluating the market potential using core research data from MEmob Back-to-School Audience Intelligence, we find a massive, highly active audience of targetable parents and family decision-makers who have been active within the past 90 days:
The GCC Back-to-School Addressable Market (2026)
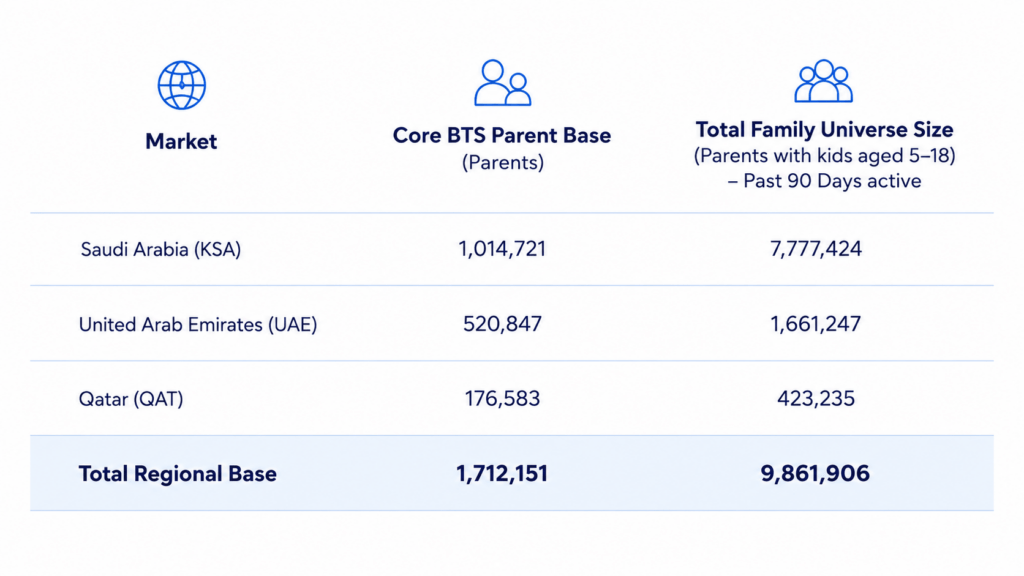
- Saudi Arabia (KSA): 1,014,721 core parents | 7,777,424 total active family profiles
- United Arab Emirates (UAE): 520,847 core parents | 1,661,247 total active family profiles
- Qatar (QAT): 176,583 core parents | 423,235 total active family profiles
- Total Regional Base: 1,712,151 core parents | 9,861,906 targetable profiles
Faced with a consumer base of this scale, it is common industry practice to gather as many location signals as possible, such as device events, ad requests, and IP pings, under the assumption that sheer volume guarantees accuracy.
In reality, unprocessed signal volume creates far more noise than clarity.
Many traditional location tools rely heavily on standard Supply Side Platform (SSP) data as a primary input.
From an engineering perspective, SSP data frequently carries an inherent positional noise or inaccuracy of up to 5 kilometers. While this level of resolution is perfectly fine for broad, contextual digital ad placement, it struggles to support precise store-level audience planning or accurate competitor footprint analysis.
It simply isn’t enough when a brand needs to answer sharper business questions:
- Which specific mall corridor is attracting actual back-to-school family foot traffic?
- Which exact stores are gaining or losing visit share to direct competitors?
- Which school catchment zones show the highest concentration of high-spending households?
- Where should the media budget be increased, reduced, or instantly redirected?
- Which competitor locations are influencing purchase journeys?
At this level, accuracy is not a technical detail. It directly affects media efficiency, market share, and revenue outcomes.
This is why raw location data cannot be treated as absolute truth the moment it is collected.
At MEmob+, every raw real-world signal is treated as a hypothesis first.
Before it becomes an audience, an insight, or a measurement point, it must pass through a validation layer that filters weak signals, removes noise, checks movement logic, scores recency, and confirms whether the data is reliable enough to guide business decisions.
The difference is simple:
Raw location data tells you that a device was somewhere.
Validated location intelligence tells you whether that presence actually matters.
Only after this validation process can brands move from broad assumption to precise action.
With validated data reaching Geohash Level 9 precision, movement can be mapped at an approximate 4.77 x 4.77 meter grid level. This helps enterprise brands distinguish between someone who genuinely entered a store, school zone, or mall area and someone who simply passed nearby.
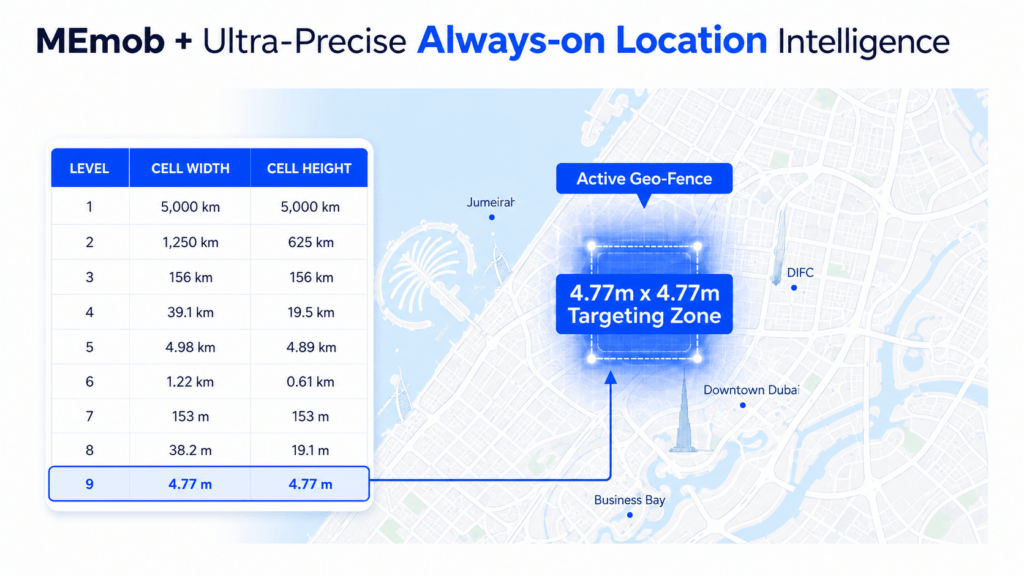
For back-to-school planning, that distinction is critical. Because the opportunity is not just to reach parents. The opportunity is to identify where real family demand is forming, where competitors are winning attention, and where media investment can be shifted before market share is lost.
Redefining the Consumer Journey: Presence Is Not the Same as Intent
One of the biggest mistakes in location marketing is assuming that being near a place means someone is ready to buy.
A device passing near a mall entrance is not the same as a parent spending two hours inside, moving from the uniform store to the food court, then to electronics, and finally to the supermarket.
Yet many platforms still count both as a “visit.”
That creates a real measurement problem.
Back-to-school behaviour in the GCC is not a quick in-and-out transaction. It is often a multi-hour family journey. Regional mall behaviour shows that families can spend an average of 2.7 hours in a mall and combine around 3.2 activities in one trip, such as buying uniforms, dining, comparing devices, visiting entertainment zones, or completing grocery purchases.
So, to understand true commercial intent, brands need to look beyond basic proximity.
Instead of simply asking, “Was this person near the location?” MEmob evaluates whether the movement reflects a genuine, commercially relevant visit.
That includes:
- Dwell Duration: Measuring time-in-zone against realistic, category-specific retail benchmarks. A quick fast-food stop, a hypermarket haul, and an electronics comparison require completely different time thresholds to qualify as real visits.
- Dwell Coherence: Analyzing internal movement consistency to separate stationary shopping presence from rapid transit passage.
- POI Boundary Precision: Mapping signals strictly against the verified physical, multi-level boundaries of a venue using Geohash Level 9 precision, completely bypassing arbitrary radius circles.
- Opening Hour Validation: Cross-referencing device timestamps against verified trading hours to ensure data reflects live consumer commerce.
For back-to-school, brands do not just need to know who was nearby. They need to know who was genuinely shopping, comparing, dining, returning, repeating visits, or moving between categories.
That is how brands can move beyond broad demographic labels and start understanding the real family profiles shaping the seasonal rush.
The Four Family Profiles Driving the Back-to-School Demand
Back-to-school audiences cannot be treated as one generic “parent” segment. Families prepare differently, shop differently, and respond to different triggers depending on timing, budget, urgency and lifestyle.
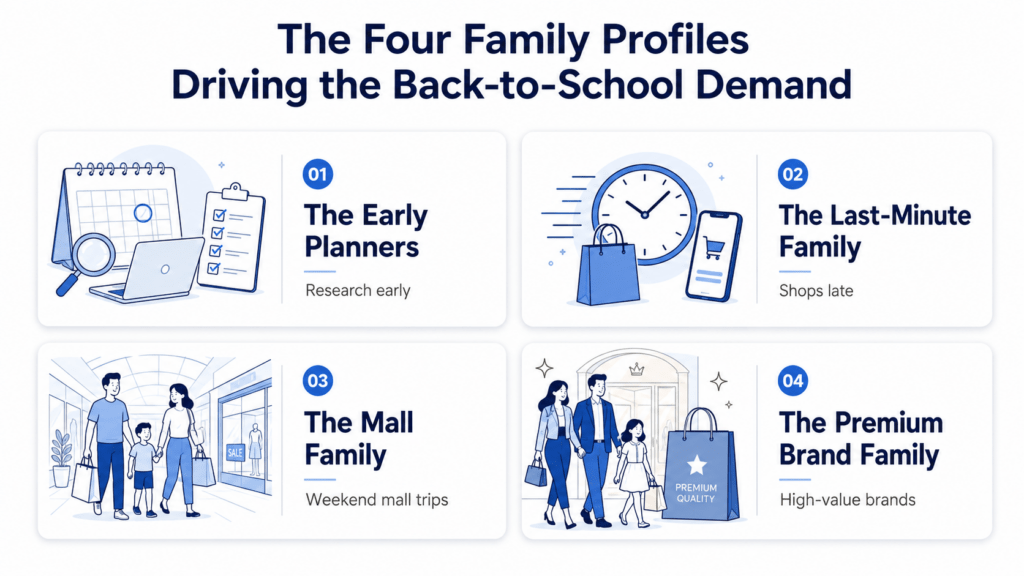
- The Early Planners: Activating as early as May and June, this segment engages heavily in deep online research and product comparison guides. They view high-ticket electronics and school items as planned household capital investments and time their final purchases with early summer promotions.
- The Last-Minute Family: Representing a massive portion of seasonal volume, these families compress their shopping into the final two weeks of August, frequently right after returning from summer travel. Their habits are highly mobile-first, characterized by large basket sizes and a strong reliance on rapid delivery apps.
- The Mall Family: They treat back-to-school shopping as a shared family weekend event. They make multiple repeat trips, distributing their seasonal budget across apparel, casual dining, stationery, and impulse retail categories.
- The Premium Brand Family: Highly concentrated within affluent residential postcodes (such as Jumeirah in Dubai, North Riyadh, or The Pearl in Doha). They prioritize international private school recommendations and top-tier technology ecosystems over standard price discounts. Recent longitudinal retail studies published by Fast Company Middle East show an established annual spending floor of USD 950 (~AED 3,500) per child strictly on electronic hardware and tech essentials during this window, validating why this premium audience represents a major capital deployment rather than simple discretionary shopping.
Grounding Strategy in Deep Regional Nuance
Global datasets are frequently built on Western urban frameworks and struggle to capture the rapid, multi-level architectural and commercial realities of the Middle East. They routinely misclassify regional hypermarket networks, miss local brand hierarchies, and overlook deep cultural and calendar shifts unique to the region.
The core data within our Audience Intelligence Report highlights distinct macroeconomic and behavioral nuances across borders that uniform global algorithms completely miss:
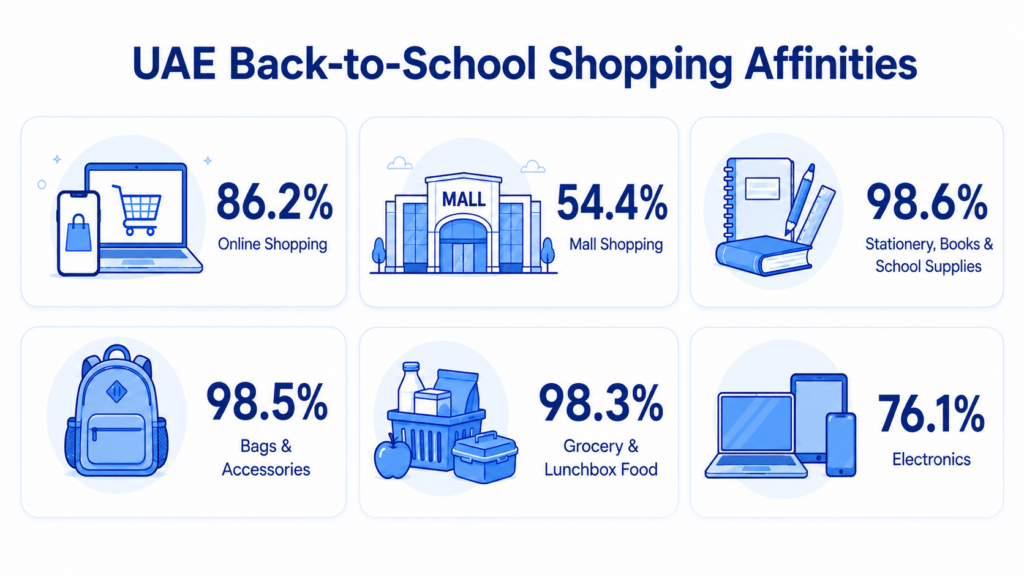
United Arab Emirates (UAE)
- UAE parents show an 86.2% affinity for online shopping, but 54.4% remain dedicated physical mall shoppers.
- When they shop, their absolute highest category focus is Stationery, Books & School Supplies (98.6% affinity) and Bags & Accessories (98.5% affinity), followed closely by Grocery & Lunchbox Food (98.3%) and high-ticket Electronics (76.1%).
Saudi Arabia (KSA)
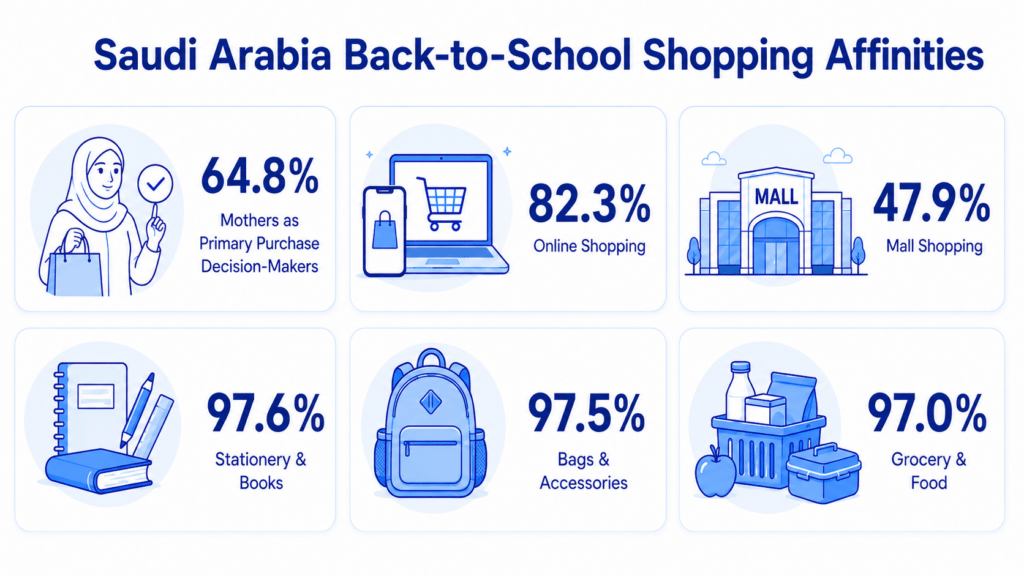
- In Saudi Arabia, domestic decisions are highly centralized, mothers command 64.8% of primary direct purchasing decisions.
- They show a powerful reliance on physical retail networks, with 47.9% designated as core mall shoppers and 82.3% engaging in online shopping.
- Their primary category spending focuses heavily on Stationery & Books (97.6% affinity), Bags & Accessories (97.5%), and Grocery & Food (97%).
Qatar (QAT)
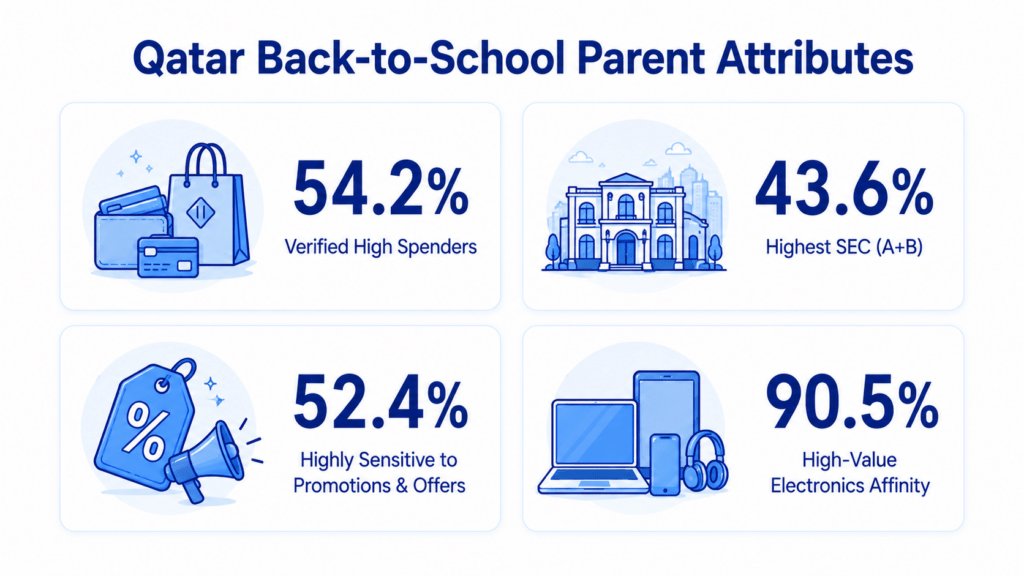
- Qatar represents an intensely affluent consumer base, 54.2% of targetable parents are verified high spenders, and 43.6% sit directly within the highest socio-economic classes (SEC A+B).
- Interestingly, they are also highly tactical, 52.4% are highly sensitive to structured promotions and offers. When it comes to product preferences, Qatar parents lead the entire region in high-value Electronics intent, showing a massive 90.5% category affinity.
The Actionable Playbook: Turning Spatial Intelligence into Direct Revenue
To translate these data points into measurable business growth, corporate strategies must align their technology deployments with observed human behaviors across specific industry verticals as we head into the August 2026 peak:
Malls & Commercial Real Estate: Capitalizing on the Mob
Our predictive models show a powerful regional shift in human movement as summer winds down. Overall mall and retail mobility is forecasted to surge from an 11.6% baseline up to a 19.5% peak by late August, with the UAE leading the charge at a 20.5% mobility high, followed by Qatar at 21% and KSA at 18.8%.
The Strategy: Move beyond simple radius boundaries. Using GeoSense, brands can deploy Isochrone Technology to map true travel-time catchments (understanding who is within a 15-minute journey) rather than arbitrary geometric distances. By mapping high-movement family corridors and the airport-to-home flows of returning vacationers, properties can deliver highly synchronized lifestyle incentives that welcome families back into their regular routines the moment they enter their home neighborhoods.
Electronics, Telecom & EdTech: Engaging High-Value Intent
Consumer electronics command the highest average order value (AOV) during the seasonal rush. Our dataset shows that the collective tech-buying parent audience across the UAE, KSA, and Qatar exceeds 1.03 million households. Intent trends are projected to stay highly concentrated, hovering at a stable 14.8% peak strength in Qatar and 6.8% in the UAE.
The Strategy: Instead of relying on generic digital ad blasts, brands can leverage AllPings to isolate verified behavioral profiles, such as the Premium Brand Family. By identifying the specific physical corridors and neighborhoods where these high-intent consumers spend time, device manufacturers and telecom providers can deliver tailored hardware-plus-data upgrades directly to households that match the exact footprint of premium technology buyers.
Banking, FinTech & BNPL: Supporting Household Cash Flow
Late August represents one of the most intense financial pressure points of the year for GCC households. School tuition fees, uniform requirements, high-ticket electronics, and supplies all arrive on the family ledger simultaneously. This structural focus matches broader government priorities; for instance, the newly published budget yearbook documented by Aletihad Newspaper via the UAE Ministry of Finance isolates AED 16.9 billion dedicated exclusively to development programs in the education sector, locking it in as an insulated priority spend zone for families.
The Strategy: Financial platforms can time their primary activations to align precisely with regional salary cycles at the end of the month. By mapping retail networks, banks and BNPL providers can deliver personalized cashback or flexible installment solutions directly to parents whose real-world behaviors indicate they are highly offer-sensitive, a segment that scales to parents in KSA, UAE, and Qatar.
Shifting to a True Measurement Discipline
The hallmark of a mature commercial strategy is a commitment to rigorous, transparent measurement. For too long, marketing departments have been forced to justify large seasonal budgets using vanity digital metrics.
In an enterprise environment, incrementality is a strict mathematical methodology, not a marketing buzzword. True measurement requires isolating baseline organic demand from media-driven causation. Without accounting for these real-world baselines, it becomes incredibly difficult to separate true campaign impact from natural foot traffic.
Through MEmob’s Stretch measurement architecture, corporate leadership receives an analytically rigorous, statistically sound breakdown of performance:
True Incremental Footfall Uplift = Attributed Visits (Exposed Group) – Baseline Demand (Control Group)
This framework deploys demographically matched Geo-Control Methodologies to ensure that external variables, such as a natural weekend mall surge, seasonal tourist shifts, or general economic trends, do not artificially inflate campaign performance figures.
Furthermore, because MEmob+ maintains native, certified API integrations with Meta, Snapchat, and TikTok at the Mobile Advertising ID (MAID) level, these validated real-world store visitors can be securely re-engaged across social channels without any data translation loss, maintaining complete consumer privacy by design.
Summary: The Strategic Path Forward
The market insights uncovered within our audience dataset demonstrate that Back-to-School 2026 is not a standard, run-of-the-mill seasonal campaign; it is a complex, hyper-localized network of human choices unfolding across three distinct regional economies.
More than 1.7 million parents and family decision-makers across the UAE, Saudi Arabia, and Qatar will move through a compressed journey of planning, buying, visiting, comparing, ordering, financing, and adjusting. The opportunity is not simply to reach them; it is to understand them at the exact moment their routines are changing.
That is why Back-to-School should be planned as a movement strategy, not just an ad campaign. The brands that win will be the ones that understand exactly:
- Where Demand Is Forming
- Which Families Are Planning Early
- Which Ones Are Acting Late
- Which Malls And Corridors Matter
- Which Categories Connect Inside The Same Journey
- Which Audiences Need Value
- Which Audiences Need Confidence
- Which Campaigns Actually Changed Behaviour
As the recipient of the Gold Industry Award for Leading Tech Enabler of the Year, MEmob+ focuses on engineering the data infrastructure and spatial AI required to make this human context clear and highly actionable for businesses. As our regional market continues to mature, winning a share of wallet means moving past broad demographic approximations. Back-to-school is not about being everywhere. It is about knowing where presence matters. And in 2026, the brands that understand family movement will have the clearest path to market share.

Let’s be honest: your competitors are going to spend this August looking at a dashboard full of internet clicks, guessing where their customers went. You don’t have to.
If you are running a retail group, an electronics brand, or a consumer bank in the GCC, let’s skip the guessing games. We can run a quick, real-world location diagnostic on your top flagship stores right now to show you exactly where your audience is slipping away from competitors and how to bring them back.
Click here to set up a chat with our team.
Frequently Asked Questions (The Simple Breakdown)
1. How can you tell if someone is a “parent” just from their phone movement?
We don’t guess based on online search history alone. We look at real-world habits over a 90-day window. If a device regularly drops off and picks up at verified school zones in the morning and afternoon, visits kids’ play areas on weekends, and spends time in the family hypermarket aisles, the system recognizes a real-world household routine. Across the UAE, KSA, and Qatar, we’ve mapped over 1.7 million verified parent profiles using these exact daily rhythms.
2. Is this tracking safe? What about consumer privacy?
Absolutely, privacy is baked into the system by design. We never collect or look at personal information, no names, no phone numbers, no private messages, and no emails. Everything is completely anonymized. The system only processes scrambled, secure digital device codes (called MAIDs) to look at general movement patterns, ensuring 100% compliance with local and international privacy laws.
3. Malls in Dubai and Riyadh have multiple levels. Can your system tell if someone is on the ground floor or the top floor?
Yes. Standard GPS or basic ad data gets incredibly confused by multi-level buildings, often stacking everyone on top of each other. Our platform uses an advanced regional mapping graph that calibrates signal strength and movement behavior specifically for major Middle Eastern malls. By combining time spent in a specific spot with the actual blueprint layout of the mall, it can tell if you’re shopping for school shoes on the ground floor or eating at the food court upstairs.
4. How does this data help if our brand sells entirely online?
Even if you are a pure e-commerce or delivery app, your customers live in the physical world. By understanding where parents spend their weekends (like specific premium neighborhoods or popular family entertainment hubs), you can time your app discounts and social media ads to pop up exactly when and where they are in a buying mindset. For example, knowing that UAE parents have an 86.2% online shopping affinity means you can intercept them with a digital offer right as they leave a physical showroom.
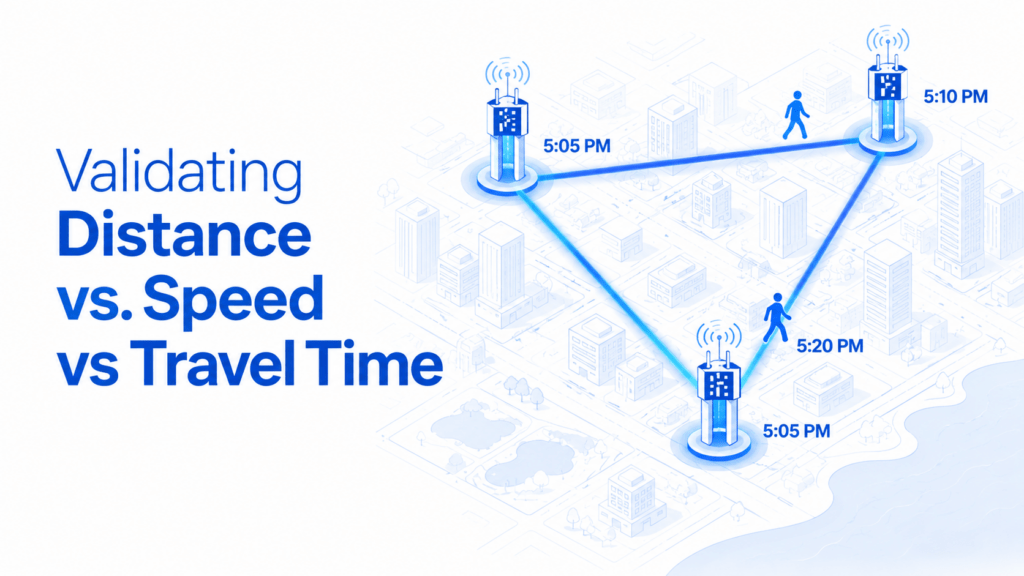
5. What is the difference between a “radius circle” and your “travel-time” technology?
A radius circle is just a lazy round shape drawn on a flat map (like a 2-kilometer circle around a store). It doesn’t care about real life. It assumes a person can fly straight through buildings or highways to get to you. Our system uses Isochrone Technology, which calculates actual real-world travel time. It maps out who can realistically walk or drive to your storefront in exactly 10 or 15 minutes, accounting for actual roads, roundabouts, and traffic flows.
6. How long does it take to see if our Back-to-School ads actually brought people into the store?
You don’t have to wait until the end of September to see if your campaign worked. Because our platform has direct, live connections with major social media networks like Meta, TikTok, and Snapchat, we can track real-world store visits while your campaign is actively running. If a specific ad isn’t bringing parents through the door, your team can pivot and change the strategy in real time before the critical 10-day shopping window closes.
About the Author
Mitali Jadia is a Marketing Manager at MEmob Global, specializing in integrated marketing, AdTech storytelling, audience strategy, and data-led brand growth across the GCC. She focuses on turning location intelligence, campaign insights, and consumer movement patterns into strategic narratives that help brands, agencies, and business leaders connect data with real commercial opportunity.
Her work spans thought leadership, go-to-market content, award submissions, case studies, and sector-focused storytelling across retail, QSR, automotive, tourism, entertainment, and hospitality.