
Geosense is MEmob’s proprietary geospatial visualization platform that transforms raw location data into live, actionable geo-intelligence maps
Through one browser-native dashboard, see exactly where your audience concentrates, plan out-of-home placements against real movement and prove the footfall impact your media actually delivered.

MAP
Audience density, dwell time, and movement across your city
PLAN
OOH & DOOH sites scored against real audience concentration
TARGET
Catchments, geofences, and competitor proximity
ACTIVATE
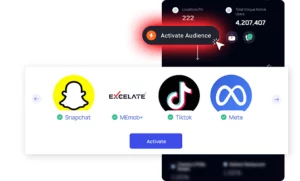
Location strategy connected to digital, retail media, and DOOH
MEASURE
Exposure-to-visit attribution and footfall lift, proven on the map
Understand how audiences move. Identify behavioral clusters and high-impact zones. Link strategy to real-world impact.
Audience - Mobility - Market Intelligence Layers Connected
7 Reasons Media Planners Choose Geosense

1. Mobility density & dwell-time mapping
Mobility density and dwell-time mapping shows exactly where audiences gather and how long they stay, hour by hour.

2. Audience concentration index & geo-behavioral clustering
Find the sites your audience is quietly over-indexed in.

3. Dynamic catchment modeling & geofence creation
Build trading areas around how people actually move.

4. Location affinity scoring & segment comparison
Compare how different audiences behave across the same map.

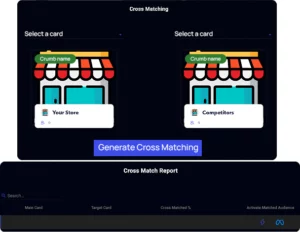
5. Competitive proximity analysis
Identify where competitor presence is strongest among your target audience.

6. OOH/DOOH exposure zone mapping
Visualize the physical reach of every outdoor placement.

7. Exposure-to-visit attribution & incrementality measurement
Prove an actual footfall lift by connecting to Stretch Tag, isolating real lift vs. a control group.

8. Time-animated playback
Hourly footfall, day-of-week rhythm, seasonal trend, and before/after campaign comparison, all on a moving map.

9. Interactive, embeddable campaign reports
Live Geosense maps dropped straight into a client debrief deck.
Geosense Knowledge Center
Expert answers to the most important questions about Geospatial Analytics, Consumer Mobility, Audience Intelligence, Geofencing & Planning of OOH Placements.
Geosense is MEmob’s proprietary geospatial visualization platform a browser-native rendering layer that turns anonymised mobility signals into live, interactive geo-intelligence maps. It is not a replacement for AllPings; it’s built on top of it. AllPings supplies the analytical depth: Audience Cards, POI-based segmentation, mobility filters ;while Geosense supplies the enterprise-grade visualization layer that makes those insights spatial, animated and immediately legible to non-technical stakeholders.
In practice, this means a brand or agency using AllPings to define an audience can use Geosense to see that audience: heatmaps of highest-affinity zones, arc layers showing commute origins and destinations, dwell-time clustering revealing preferred hangouts, and overlap between a brand’s audience and a competitor’s footprint. When Geosense is connected to Stretch measurement, the same view extends into attribution showing whether media exposure in a given zone translated into real-world visits.
Geosense closes what MEmob calls the decision gap: giving brand, media and commercial teams a shared, visual answer to three questions before, during and after activation; who are we really reaching beyond demographic proxies, where do audiences live/work/shop/dwell, and did the investment influence real-world movement or only media metrics.
Geosense processes anonymised location data through a four-step pipeline, moving from raw data to a measurable business outcome.
1. Mobility Data Ingestion: anonymised GPS signals, device location pings, Wi-Fi detections and behavioural app data are aggregated into movement profiles across every geography.
2. Audience Segment Mapping: behavioural segments are built from real-world movement patterns rather than demographics alone (financial district commuters, fitness enthusiasts; defined by what they do, not who they’re assumed to be).
3. Location Intelligence & Indexing : every physical environment (OOH unit, retail zone, transit corridor, commercial district) is scored and indexed against the target audience profile, surfacing the highest-index locations.
4. Measurement & Attribution: exposed audiences are tracked against matched control groups to isolate true campaign impact: footfall lift, branded search uplift, digital conversion uplift.
The result is a single connected view running from ingestion through to proof of impact, rather than four disconnected tools.
The Geosense Intelligence Model is the three-layer analytical framework that turns raw movement into a market decision, and it’s the structure behind everything the platform visualizes.
Audience Intelligence: behavioural segments built from real-world visitation, affinity and frequency, answering who is actually being reached.
Mobility Intelligence: flow, dwell, daypart, catchment and movement patterns across the city, answering how and when audiences move.
Market Intelligence: competitor overlap, opportunity zones and location-level demand signals, answering where the commercial opportunity is strongest.
Layered together, these three intelligence types are what let Geosense move a team from “where should we place media” to “what impact did that placement actually deliver.”
Geosense replaces radius-based OOH guesswork with spatial evidence by overlaying audience footfall heatmaps directly onto OOH site coordinates, so planners can see which placements sit inside genuinely high-density audience zones and which are wasted impressions before a single site is booked.
The workflow runs in four stages, matching how media and creative teams already work: Plan: load audience heatmaps against candidate OOH sites and buy from spatial evidence rather than assumption. Target: define geo-targeted digital and in-store proximity activation zones from the same behavioural data, so digital and physical planning use one audience definition. Measure: a post-campaign split-map comparison shows footfall before vs. after by zone and store; the map is the measurement, not a table a client has to interpret. Report: live Geosense maps are embedded directly into campaign debrief documents, so clients interact with the data instead of reading it.
This is also where the platform’s time dimension matters most: hourly footfall animation identifies peak windows for staffing and campaign timing, day-of-week rhythm shows how Monday behaviour differs from Saturday, and seasonal trend playback animates a full year; useful for showing how tourism flows shift in high season or how retail density changes during Ramadan.
Geosense measures impact by comparing an exposed audience against a matched control group and isolating what movement change is actually attributable to the campaign; not just correlated with it. This is where Geosense’s visualization layer connects directly to Stretch, MEmob’s attribution and measurement product.
Rather than reporting impressions delivered and assuming an outcome, the connected workflow produces incremental footfall lift, cross-channel impact analysis, and exposure-to-visit attribution, all visible as a before/after split-map rather than a table of aggregate numbers. That distinction matters commercially: it’s the difference between “impressions delivered, outcomes assumed” and “incremental lift proven, control group isolated”; the second gives a media buyer or brand team something they can defend in a budget conversation.
A standard mapping tool answers “where is this location and what’s nearby.” Geosense answers “who moves through this location, how often, and did marketing investment change that behaviour”; because it’s built as a decision layer on top of mobility and audience data, not a cartography tool.
The distinction shows up in three places.
First, audience behaviour over static geography; Geosense’s maps are built from real movement (dwell time, daypart, frequency, catchment), not just coordinates.
Second, the time dimension most analytics show what happened in aggregate; Geosense shows when and where it happened, in motion, as hourly, weekly and seasonal animated playback.
Third, the connection to outcomes because Geosense sits on top of AllPings’ audience intelligence and links to Stretch’s measurement, a location view isn’t the end product; it’s the starting point for planning, targeting and proving impact, inside one platform rather than three disconnected tools.
Geosense is built for any brand, agency or commercial team that needs a shared, visual answer to where audiences are, how they move, and whether media investment changed that behaviour most directly, OOH and DOOH planners, media and advertising agencies, and brand/commercial teams running location-based or omnichannel campaigns across MENA.
For media and advertising agencies, Geosense turns audience discovery and OOH planning into a spatial, client-facing deliverable rather than a spreadsheet; the same map used to plan the buy becomes the map used in the debrief. For brand and commercial teams, it gives marketing, retail and expansion functions a common view of audience quality, physical context and commercial outcome, so budget conversations run on visible evidence rather than assumption. For retailers, tourism boards, automotive and other location-dependent industries already using AllPings for audience intelligence, Geosense is the natural next layer it makes those audiences visible in space and, connected to Stretch, provable in outcome.
Traffic counts estimate how many people pass a location; Geosense identifies who those people are, whether they match a target audience, and whether exposure changed their behaviour. Two sites with identical traffic can score very differently in Geosense depending on which audience segments actually move through each one. It also closes the measurement gap traffic counts leave open measuring actual exposure-to-visit attribution and lift, not just potential reach.
Yes. OOH, DOOH, mobile geo-targeting, and retail media proximity campaigns can be planned from the same audience-concentration data. Geosense’s exposed-vs-control-group methodology isolates incremental lift per placement, and when paired with Stretch, extends into cross-channel impact analysis connecting OOH exposure to footfall lift, branded search uplift, and digital conversion uplift in one report.
Yes. Geosense uses aggregated, anonymised mobility signals, the same privacy-first foundation as AllPings and supports compliance with GDPR, CCPA, and PDPL. No personally identifiable information is exposed during audience mapping, catchment modeling, or attribution.